
 This week the students are looking at where to start with using Google Analytics reports and what information matters. If you haven’t already linked Google analytics to your website, then set up a Google account and place the Analytics code on each page of your site. Your web developer can do this for you also.
You can spend a lot of time going through data without a focus on what you need to know. Stay focused on three things: Data, Insights and Action. What you are looking for is information that will help you make decisions to improve your website and make it easier for your users to get what they are searching for. One of the topical sets of data that businesses look at, presently, is the number of visitors who are accessing their websites through their mobile phone or tablet. This insight will inform your decision on your need for a mobile friendly site. Get information that lets you better understand your website users’ behaviour to take actions that are useful and relevant.
So now what? Before you go to the extensive reports that Google supply begin with a pen and paper and write down the three main reasons why your website exists. This will give you a set of objectives for your website. Next list the things your website needs to do or what you want the visitor to do. These are your website goals. Then list the groups of people that matter most to your website. This is your target audience. With these three categories of information you are now ready to identity the data that you need. In Analytics speak this data is called KPI’s – Key Performance Indicators. A KPI might be the number of downloads of a ‘white paper’. the number of subscriptions to a newsletter or the number of repeat visits to a particular page. Put numbers on these KPI’s with specific targets and a time period to achieve them. Now you are ready to get the reports from Google Analytics. 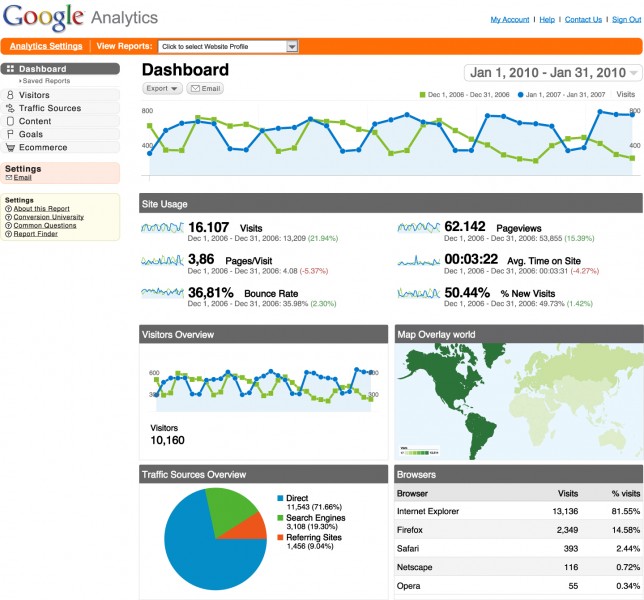 Create a dashboard with the reports that are most important to you and set a comparison on the data you get from one month to the next so you can see the historical performance of your site to identify trends in the data.
The final stage is to use this data to make useful, actionable decisions for your business. For example a company maybe focusing its efforts in one geographic location but see that their website visitors are coming from a different location. Changing your strategy to incorporate this new location will impact positively on your business.
Next week we will be looking at email as part of a Digital Marketing Strategy.


 How we communicate with our customers is the next step. Think of how you would act if you entered a room full of people you have not met before. You wouldn’t stand and announce to the room how wonderful you are and really everyone should pay attention to what you have to say. Listening to what people are talking about and joining the conversation is a much more effective way of engaging with your audience. Guiness created Arthur’s Day in order to meet their customers where their passions lie in music. Connecting your brand to your customers where they hang out and becoming an integral part of their experiences will increase the opportunity for engagement and building relationships with them online.